Journal of Biomechanics dataset
Step-by-step tutorial on how to use the dataset form the paper in Journal of Biomechanics
This tutorial covers the basic usage of the dataset from A comprehensive, open-source dataset of lower limb biomechanics in multiple conditions of stairs, ramps, and level-ground ambulation and transitions
For this example, let’s focus on obtaining the average ankle moment profiles during walking on a treadmill at different speeds. We will do that in 5 steps.
Step 1. Check the paper
If you haven’t read the paper, I recommend to look at the methods to see what this is all about. Also, the
supplemental material contains some instructions on how to use the dataset and the scripts. We will cover those instructions
step by step in this post.
Here is the bibtex reference if you want to cite:
@article{CAMARGO2021110320,
title = {A comprehensive, open-source dataset of lower limb biomechanics in multiple conditions of stairs, ramps, and level-ground ambulation and transitions},
journal = {Journal of Biomechanics},
volume = {119},
pages = {110320},
year = {2021},
issn = {0021-9290},
doi = {https://doi.org/10.1016/j.jbiomech.2021.110320},
url = {https://www.sciencedirect.com/science/article/pii/S0021929021001007},
author = {Jonathan Camargo and Aditya Ramanathan and Will Flanagan and Aaron Young},
keywords = {Locomotion biomechanics, Stairs, Ramps, Level-ground, Treadmill, Wearable sensors, Open dataset},
Step 2. Download the dataset and scripts
You can get the dataset and scripts from the EPIC lab website or the Mendeley data repository.Make sure you download the scripts, as you will use them in the next steps. Download as many subjects as you want, but you don't need to have all the subjects to run the code.
The subject information is in SubjectInfo.mat, you
will need it too, since we want to normalize the moment by subject weight.
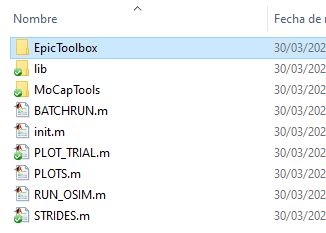
Step 3. Setup EpicToolbox dependency
EpicToolbox is a repository that helps to manipulate structures with data tables. It makes the processing of data from multiple sensors more easy to do, so we can access elements by their name instead of using matrices and indices.You can get the latest EpicToolbox from the github repository, or just use the one included in the scripts folder from the paper.

On your Matlab command window, go in the EpicToolbox folder and run install.m. That’s it!
Step 4. Split the time series in strides
The data comes as time series of the experiment circuits. In this case we don't want time series data, but average profiles over gait cycle.So, we are going to use the STRIDES.m script to split the time series steps based on the gait cycle (heel contact to heel contact).
On STRIDES.m edit line 7 with the ambulation mode you want to process. In this case I will only do treadmill.
ambulationModes={'treadmill'};The STRIDES.m script will process one subject at a time. Thus, I need to define the variable SUBJECT for each subject I want to
process, and then run STRIDES.m.
On the command window:
>> SUBJECT='AB06';
>> STRIDES
Processing strides for subject AB06
>> SUBJECT='AB07';
>> STRIDES
Processing strides for subject AB07
>> SUBJECT='AB08';
>> STRIDES
Processing strides for subject AB08
>> SUBJECT='AB09';
>> STRIDES
Processing strides for subject AB09
>>% I will stop here and process only 4 subjects
Alternatively, use the BATCHRUN.m script to process multiple subjects in sequence using a for loop.
Step 5. Use the data
Now you should have a STRIDES/ folder containing the individual stride data for each subject.
You can use PLOTS.m to read from the strides folder and create the plots or script you own analysis.
Let’s look at the PLOTS.m script to see what you can do. On lines 3-8 you can select the ambulation mode and
the dependent variable of interest (sensor table, channel column). In our case, we want to observe the inverse dynamics id and
from that, the channel ankle_angle_r_moment. You can reuse this script for any other variables. The commented lines are
other examples.
% Select an ambulation mode and a sensor/channel of interest
AMBULATION='treadmill';
%sensor='ik'; channel='hip_flexion_r';
%sensor='emg'; channel='gastrocmed';
%sensor='imu'; channel='thigh_Gyro_Z';
sensor='id'; channel='ankle_angle_r_moment';
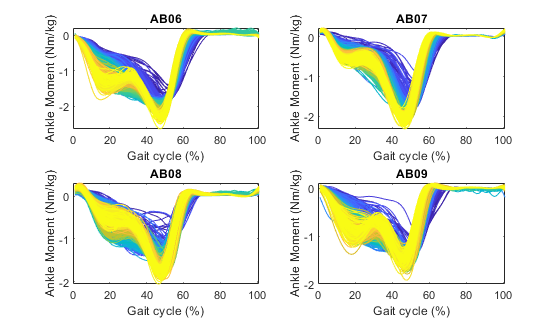
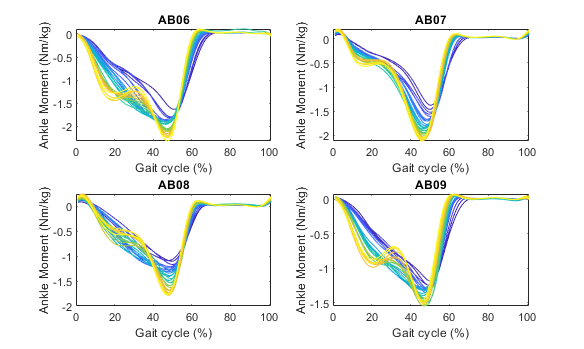
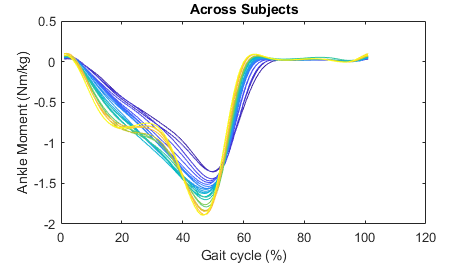
After running this script you will have plots showing the individual stride data per subject, the average across strides per subject, and the average across subjects. All the plots are color coded with respect to the condition (in this case, the condition is treadmill speed).
All strides

Subject Average

Mode Average

That’s all for this post. Feel free to reach out @jcamargo_co if you need more information!